 If you’re just looking for the latest college graduation rate statistics, according to the National Center for Education Statistics (NCES) the 4-year graduation rate for four-year colleges in the United States is 42%. For private colleges, it is 54% and the 4-year rate for public institutions is 37%. This is for students starting in 2011. These statistics are not the same as you’ll often see reported by the media. That’s because they are reporting the 6-year graduation rates. The 6-year graduation rate is 60% overall and 66% for private colleges and 59% for public colleges.
Table of Contents
- Quick Numbers
- Different Types of College Graduation Rates
- Original Data Sources
- Resources to Access the Data
Quick Numbers
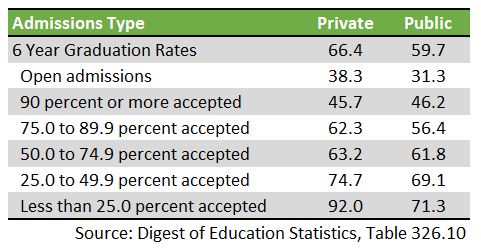
According to the NCES, based on the 2011 cohort, private colleges have the highest graduation rates followed by public schools. For-profit colleges have the lowest graduation rates among 4-year schools.
 Not surprisingly, graduation rates increase as acceptance rates decrease.
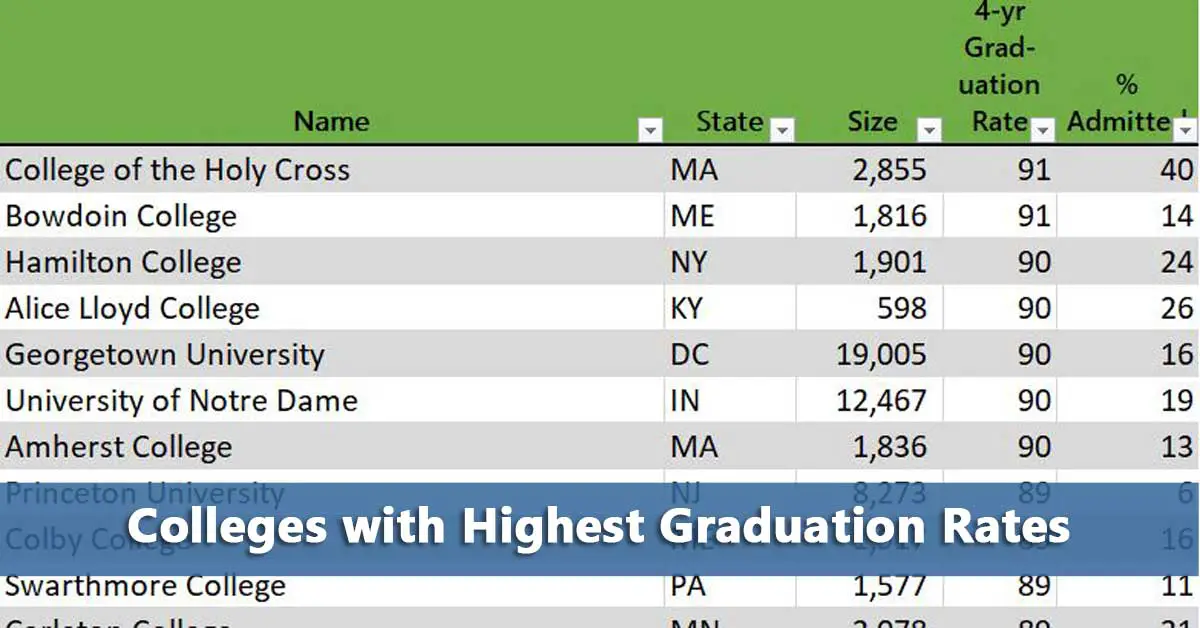
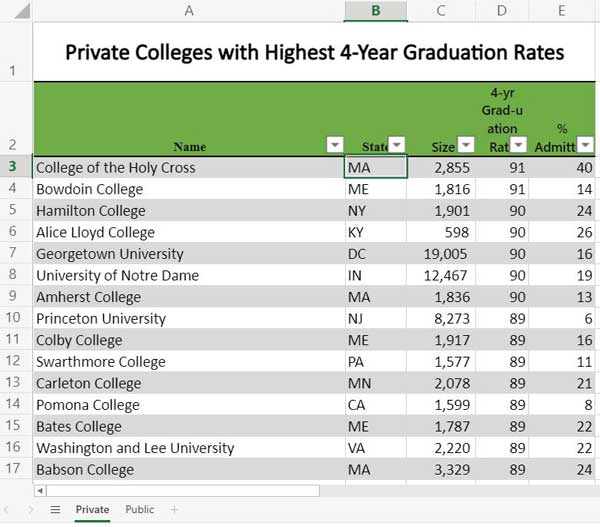
Colleges with the Highest Graduation Rates
The following table lists colleges with the highest 4-year graduation rates based on data available from IPEDS in June of 2019. The first tab shows the top 20 private colleges and the second lists the top 20 public colleges.
Listing of Colleges with Highest Graduation Rates
Different Types of College Graduation Rates
It’s important to understand the different graduation rates being reported. The 4-year graduation rate is the percentage of full-time freshman attending a four-year institution who graduate in four years. Obviously, this doesn’t include students who start part-time, transfer in, or are returning students.
Whether or not to include these students in college graduation statistics, and how, is a source of controversy. Many colleges have long complained that their graduation rates are underreported since students who transfer from their college are essentially counted as dropouts.
The president of Pace University, Marvin Krislov, explains how the graduation rates effect his institution in an article at Forbes Magazine:
we would show a 49% six-year graduation rate. But we also have another 16% who transferred and earned a bachelor’s elsewhere. We have 2% who completed an associate’s degree. We have 11% who are still enrolled. That’s 78% who have earned a degree or are still working toward one.
These statistics are based on data from the Student Achievement Measure (SAM) rather than the federal government’s Integrated Postsecondary Education Data System (IPEDS). The argument is that IPEDS needs to provide more detailed statistics to accurately represent student achievement.
However, the Pace University example shows some of the problems of these graduation rates from the perspective of the families that foot the bill.
Perhaps the biggest problem is that the 6-year rate is considered the standard. Most students certainly don’t plan to pay for 6 years of college and that is generally not mentioned in the view books or campus tours. According to SAM, the 4-year graduation rate for students starting at PACE in 2012 was 38% compared to 52%. We’re talking about a private college that charges over $60,000 a year-why should we be focusing on 6-year rates?
And please don’t blame this on the students. They changed majors, they took the wrong courses, whatever. What exactly are they getting for the $60K a year?
As for the other information on the student’s status, I really don’t see why it should mitigate the graduation rate. Completing an associate degree or still working on their 4-year degree 6 years later is a problem. And why should Pace receive credit for the 16% who transferred? We don’t know why they transferred and what additional costs they incurred in doing so.
Transfer Graduation Rates
The issue becomes even more murky and depressing when considering transfer students. According to SAM, only 28% of students who transferred to Pace graduated within 2 years. 67% graduated within 4 years which would seem like a major accomplishment. But for all the reasons I can imagine the president providing to explain why only 28% graduate within 2 year, the same would apply for 4 years.
The argument would be something like, they only transferred a year’s worth of credit. Or maybe they weren’t able to accept credits because they weren’t university quality work. Therefore, 28% in 2 years is pretty impressive.
But what about the students who transferred in with 2 years worth of credit, or maybe even 2 1/2 or 3? Are they being counted in the 4-year graduation rate? The problem is that we don’t know where transfer students actually started.
We don’t know:
- How many credits they completed elsewhere
- How many they were able to transfer
- How many counted towards their degree
And given that the receiving university for transfer students, especially private schools, set their own standards for what counts, how can you actually compare the graduation rates for transfer students between colleges?
Yet, the fact that transfer students have already financially invested in their education seems to be ignored when considering graduation rates. In New Data Highlight How Higher Education Is Failing Part-Time Students, the Center for American Progress concludes that
Transfer students—especially part-time transfer students—are almost always more likely to obtain a credential than their first-time peers, likely in part because they have accumulated credits at their previous institution. They also may be more likely than first-time students to have figured out how to succeed in college or to have decided what they want to get out of their education.
No kidding! Think about it in terms of baseball. The graduation rate is designed to tell us what percentage of batters actually make it all the way around all of the bases to home plate to score a run. Transfer students aren’t starting at home plate so of course their chances of getting around the bases faster is going to be higher. But the transfer rates don’t take into account if the player started at 1st, 2nd, or 3rd base at their new university. It also doesn’t say what base they were at when they left their previous institution. Without this information, how useful are transfer graduation rates?
Context Matters
The argument the Pace president makes about its student body is probably the most relevant.
More than half of our students are the first in their families to attend college. A third come from low-income families. Many are returning adult students, veterans, students of color, international students and immigrants.
It is not really fair to compare its graduation rate with Harvard’s or Stanford’s. This is why The Washington Monthly pioneered the use of “expected graduation rates” in its rankings. Using information on the freshman class such as percentage of students with Pell Grants, test scores, etc, it calculates an expected graduation rate. This allows users to see if a college’s actual graduation rate is better or worst given the students it starts with. US News College Rankings now includes an expected graduation rate as part of its methodology.
And here’s where I can understand why colleges are so eager to augment their 4-year graduation rates in any way possible. Because the media too often will simply report graduation rates without any consideration of comparing apples to apples. Why should Pace University’s graduation rate, where 32% of the freshman receive Pell Grants, be compared to Harvard’s where only 17% of freshman receive Pell Grants? And that’s just one critical difference between the two institutions. Yet, most people would only see the headlines reporting two numbers, 42% and 87%. The question is, are those good numbers for their student populations?
Original Data Sources
Integrated Postsecondary Education System (IPEDS)
The principle data source for graduation rates is the federal Integrated Postsecondary Education System (IPEDS). This is a major source for most of the college search websites and college rankings. Users can find 4, 6, and 8-year graduation rates for 4-year institutions and 100%, 150%, and 200% for 2-year or less institutions. Along with breakdowns of the 6-year rate by gender and racial/ethnicity categories, IPEDS now reports rates for Pell Grant and Subsidized Stafford Loan recipients. There is also information on transfer students and those still enrolled.
The federal government collects the information from a variety of surveys colleges are required to complete throughout the year. Colleges are required to complete these surveys to participate in the various federal student aid programs.
The completion of all IPEDS surveys, in a timely and accurate manner, is mandatory for all institutions that participate in or are applicants for participation in any federal financial assistance program authorized by Title IV of the Higher Education Act (HEA) of 1965, as amended. The completion of the surveys is mandated by 20 USC 1094, Section 487(a)(17).
Institutions can be fined for not completing the surveys or reporting inaccurate data.
Not all of the data will be from the same year.The graduation rates data is not among the first data sets updated in the system. Furthermore, data will be released throughout the year as provisional data and final release data. Data may also appear in the College Navigator before it is released to the general public.
Common Data Set (CDS)
The Common Data Set (CDS) is data is a collaborative effort between higher education institutions and publishers. The institutions voluntarily provide the information for the College Board, Peterson’s, and U.S. News & World Report. The idea is that by providing the information requested, colleges receive free publicity. Unless reported on the college’s website, this information is generally considered proprietary.
There is significant overlap between the IPEDS and CDS data. In fact, CDS refers to IPEDS for complete definitions on what data to include for graduation rates.
The items in this section correspond to data elements collected by the IPEDS Web-based Data Collection System’s Graduation Rate Survey (GRS). For complete instructions and definitions of data elements, see the IPEDS GRS Forms and Instructions for the 2018-19 Survey.
Therefore, the calculated graduation rates should be the same between the two sources.
The CDS provides 4, 5, and 6-year graduation rates. It also now includes breakdowns by Pell Grants and subsidized Stafford Loans. It does not include information by gender or racial/ethnicity categories and there is no transfer information.
National Student Clearinghouse
The National Student Clearinghouse calculates graduation rates based on its role in tracking students’ college transcripts. It does not directly provide graduation rates by college, only providing national and state level graduation rates. Furthermore, it relies on the SAM methodology for calculating graduation rates which includes students who transfer to the institution during the cohort’s year. It’s not clear if students are assigned to the new school’s cohort based on their cohort at their previous school.
Resources to Access the Data
With the exception of the IPEDS data, you can’t really access the data directly. In the case of the CDS data, there is the issue of why bother since it is using the exact same definition as IPEDS? If you are looking to analyze it in the context of other data only available through the CDS, this would make sense.
College Navigator
If you’re just looking for one or a couple of schools, you can use College Navigator to quickly look up the graduation rates. You cannot search for colleges by graduation rates. College Navigator lists 4, 6, and 8-year rates broken down by gender, race/ethnicity, and Pell Grant status.
College Scorecard
College Scorecard is the system created under the Obama administration that was supposed to make it easier for students to search for and compare colleges based on results. Unfortunately, political pressure resulted in the preliminary search function to exclude such criteria. However, once you enter a basic search, you can filter colleges by graduation rates.
The filter is based on the 6-year graduation rate which is displayed on the individual school profile. The school profile also has a feature that will let you see the 8-year graduation rate by changing the definition to include transfer students as well as part-time students. Not sure I would rely on it yet but could be very useful in the future.
The first thing to know about College Scorecard is that you can skip the interface completely and just download all of the data. This will include all the variations of the 6-year (150% time to completion) graduation rates. It also includes a 4-year rolling average graduation rate. The second thing to know is that the data tends to lag behind that displayed by College Navigator.
IPEDS
IPEDS offers a variety of ways users can look up graduation rates directly. I don’t think anyone would claim that the interface is intuitive. However, with a little perseverance, users should be able to download the exact graduation rates they’re interested in along with any additional information to provide context. This is why I created my DIY College Rankings Spreadsheet to save people the trouble.
College Results Online
The Education Trust has created the most flexible option for accessing graduation rates. Users can search by specific school or by a range of graduation rates. The individual school profile shows the 4, 5, and 6-year graduation rates as well as the 6-year graduation rates over time. It also displays graduation rates by Race/Ethnicity, and Pell Grant Status.
I think the most useful feature on the profile is the graph comparing graduation rates with comparison groups. This allows users to start comparing apples to apples. Another useful feature is that you can download all of the results for a tab, such as graduation rates, into an Excel spreadsheet which can really make it easy to start comparing colleges. The only problem with College Results Online is that there tends to be a lag in updating the data.
Chronicle of Higher Education
The Chronicle of Higher Education is a tempting website to use for graduation rates. The individual school profiles include graphs of graduation rates broken down by the various categories as well as including the US average for public or private rates as appropriate. Users can also compare it to its peers (Pace is compared to Duquesne, Adelphi, and Ball State among others) and even create a custom group of peers. All of the data can be downloaded into a spreadsheet. Overall, this website does an incredible job of providing the necessary context for the graduation rates. The problem is that the last time it was updated was in 2015.
National Center for Education Statistics (NCES)
NCES compiles a variety of tables with national graduation rates by institution type, gender, race/ethnicity, over time and more. These are part of the Digest of Education Statistics. The graduation information is in the “326 Completion Rates” section and pretty much serve as the “official” national graduation rate. All the tables can be downloaded as an Excel spreadsheet.
Student Achievement Measure (SAM)
If you’re interested in using the data from the National Student Clearinghouse, you’ll need to do it through SAM. You can get information on a surprising number of colleges listed through the program but not nearly all of them. You will only be able to view the information on individual school profiles, there’s no way to compare them or search based on graduation rates.

3 thoughts on “Essential Guide to College Graduation Rates”